The biannual Spokes city centre traffic count, on May 16, found a further substantial rise in bike traffic as compared to May 2022, whilst motor traffic was fairly static (pun intended!) Bike numbers were up at all our 4 count points and in both time periods, whilst cars and commercial (van, bus etc) were both largely unchanged from last May.
In total, combining northbound and southbound on Lothian Road and Forrest Road, bikes rose to 16.3% of all 8am-9am vehicles, from 12.7% last May, and at lunchtime to 10.8% from 9.2%.
A top takeaway is that bikes totalled 21.2% of all citybound vehicles between 8-9am at our two northbound count points, 18.6% on Lothian Road and 25.0% on Forrest Road.
It is important to note that our main counts are just snapshots on one day, and are only city centre. To make them as comparable as possible we always use the same day of the week, a Tuesday, and the same time of year, but there could be one-off factors which affect particular counts.

| City centre, 8-9am | Nov 2020* | Nov 2021 | May 2022** | Nov 2022** | May 2023 |
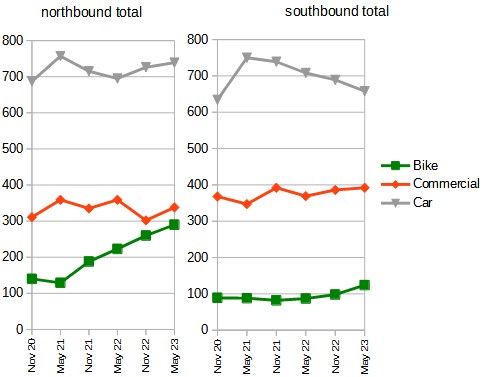
| Bikes | 229 | 270 | 310 | 358 | 414 |
| Commercial (bus, taxi, van, etc) | 679 | 727 | 728 | 688 | 730 |
| Private car | 1321 | 1454 | 1403 | 1415 | 1397 |
| Bikes as % of total traffic | 10.3% | 11.0% | 12.7% | 14.5% | 16.3% |
| % of cars which are single-occupant | 79.0% | 75.4% | 77.7% | 74.0% | 77.0% |
We started doing lunchtime counts (1230-1330) in November 2021. Although commercial traffic levels at lunchtime are similar to rush hour, there are many fewer cars and bikes, and a smaller rise in bikes as a % of all vehicles. Anecdotally, one of our counters felt that delivery bikes formed a significant element of lunchtime bikes.
| City centre, 12.30-13.30 | Nov 2021* | May 2022** | Nov 2022** | May 2023 |
| Bikes | 202 | 178 | 142 | 208 |
| Commercial (bus, taxi, van, etc) | 788 | 718 | 710 | 713 |
| Private car | 1174 | 1041 | 956 | 1012 |
| Bikes as % of total traffic | 9.3% | 9.2% | 7.9% | 10.8% |
| % of cars which are single-occupant | 69.7% | 70.1% | 67.6% | 70.3% |
Covid recovery
Covid made a massive change to travel patterns, and we still seem to be in a period of flux with changed patterns emerging. Sadly, Councils have so far failed to take sufficient advantage of this flexibility, to provide conditions which encourage more sustainable and active patterns than pre-covid. The recent re-opening of North Bridge to 2-way motor traffic is an example.
In particular, our counts suggest that people continue to return to workplaces in the city centre, with increasing numbers deciding that bike is the best way to get there, whilst the numbers choosing car are little changed. Although, surprisingly, the biggest % rise in bike traffic was southbound at Forrest Road – up from 48 bikes in 2022 to 81 this year.
Lothian Road
Despite its hostile environment, marginally more bikes used Lothian Road citybound, compared to numbers on the more pleasant Meadows route – suggesting great potential for the Council’s promised ‘Lothian Road boulevard‘ project, with its segregated bike lanes, reduction in car lanes, and major safety improvements at the West End and Tollcross junctions. [The Council now has funding for preliminary design, but implementation seems several years away, unless there is a rethink].
North Bridge 2-way reopening [** in above table]
Our counts are held at George IV Bridge (Forrest Road) and Lothian Road, both of which run parallel to North Bridge. The Bridge was closed to northbound traffic for around 2 years, but the impact on the nearest south-north alternative, Forrest Road, has been puzzling. There was little change in car numbers at Forrest Road (or Lothian Road) when the closure took place; and now that the northbound bridge closure has been removed we found a substantial reduction in Forrest Road motor traffic southbound and a marginal rise northbound.
Northbound v Southbound
Perhaps not surprisingly at commuting time, given likely journey distances, many more bikes travel northbound (i.e. towards the city centre) than southbound, whereas car numbers are more even. At lunchtime, however, both bikes and cars are fairly evenly spaced between northbound and southbound.
These patterns result in bikes forming over 21% of citybound rush-hour vehicles (25% at Forrest Road), compared to around 10% southbound, and around 10% in both directions at lunchtime.
| City centre, travel direction | northbound 0800-0900 | southbound 0800-0900 | northbound 1230-1330 | southbound 1230-1330 |
| Bikes | 290 | 124 | 105 | 103 |
| Commercial (bus, taxi, van, etc) | 338 | 392 | 334 | 379 |
| Private car | 739 | 658 | 489 | 523 |
| Bikes as % of total traffic | 21.2% | 10.6% | 11.3% | 10.2% |
| % of cars which are single-occupant | 80.2% | 73.3% | 70.8% | 69.8% |
Single occupany cars
Single occupancy means a huge amount of roadspace used to transport just one person, as compared to the space required by a person cycling, walking or using the bus. The increasing presence of SUVs makes this disparity even worse.
Single occupancy remains high at all times, but is worst in the peak period at 75%-80% compared to around 70% at lunchtime.
Portobello count and City Centre comparison
Spokes Porty now does a traffic count in Brighton Place at the same times as our City Centre counts.
Porty bike numbers have stayed static at 70-80 over several years (totalling morning and lunchtime counts). However car numbers, which had risen significantly in 2022, from around 500 to 600, rose no further in this count – perhaps the town is just too jammed to take more cars! In total bikes formed 8.7% of all vehicles, compared to 9.3% in May 2022.
Although there were fairly similar numbers of cars at lunchtime as in the rush hour (329 v 271), bikes were very much concentrated in the rush hour (54 v 21).
Comparing the Porty results with the city centre show fairly static car numbers at both, and a similar pattern of slightly more single-occupancy in the rush hour as compared to lunchtime. However, bike numbers also remain static in Porty, whilst substantial growth continues in the city centre.
Of course, these are only snapshots, taken on just one day; and they may or may not be representative of other suburban areas, or other times.
South Edinburgh
A mini-count was conducted by Spokes South Edinburgh, 8-9am only, counting bikes only, at two locations, Morningside Station and Braid Avenue. A table of results and explanatory notes is here. The only available comparison is with a November 2022 count at Braid Avenue. Here the number of cyclists increased from 95 to 103, despite the worsened traffic conditions installed at the junction in December 2022. Of the 103, 13 were adults with (17) children on board, whilst 9 were independent child cyclists.
Policy questions and lessons
- Again, we emphasise that our counts are one-day snapshots, and only during two one-hour slots; but they do suggest trends, some hopeful, some concerning, which need thought and attention
- The Scottish Government in December 2020 made a remarkable “commitment” (not just a “target”) to reduce car-km 20% by year 2030; and Edinburgh City Council following this up with an even tougher “target” of 30%. See background and links in this article. Yet car numbers are not yet reducing. The Council has significant intentions for active travel and public transport; but experts agree that this is insufficient unless accompanied by strong demand-management measures to reduce car travel. Car parking permits have been increased, and are to be re-assessed in October; and Transport Convener Cllr Scott Arthur has suggested that congestion charging could be on the way. Such measures are tough for politicians, but are vital.
- The previous Council developed encouraging on-paper policies to boost active and sustainable travel, and cut car use, as in the City Mobility Plan (p44), City Centre Transformation and 20-minute neighbourhoods [i.e. a car-reduced neighbourhood where residents can access most of their daily services and amenities in a single 20-minute round trip walking, cycling, ‘wheeling’ (wheelchairs, scooters, prams) or bus]. However, action on these was disappointingly slow. The new Council has begun implementation in Leith and Corstorphine, but needs to speed up attention to further areas.
- Post-covid traffic patterns, at least in the City Centre, are still evolving. This gives the Council the opportunity to shape what is happening, before people get too habituated into new routines, but signs so far are disappointing. Whilst LEZ enforcement starts next year, rather than using this to reduce traffic, the Council intends to increase traffic capacity on Morrison Street, a vital connection for cycling and walking. And although North Bridge was successfully closed to northbound traffic for 2 years for repairs, it has now been re-opened to 2-way traffic. And on a smaller, but telling, note, the cyclist safety ‘defenders’ which were removed by the previous council at corners on the Mound, apparently to facilitate buses during North Bridge closure, have not been replaced.
Resources …
- Full count data are here. See also our count data page for earlier surveys and trends.
- Please retweet our tweet of the count
- Covid brought major changes in commuting patterns, as many people began working from home, and many bus/rail users are thought to have changed to car. This early major change, and its impact on numbers and trends at that time, which may still be influencing traffic patterns to some extent, was discussed in our count article of November 2020.